Charts
Visualise your data
Whilst there are a variety of chart types, all charts have some common properties:
- Title
- Provider
- Label Column
- Data Column(s)
- Width & Height
- Margin
- Custom CSS
- Conditions
Providing data
Charts allow you to visualise data from a Data Provider, which can have datasources such as:
- Budibase DB
- REST Queries
- Custom Queries
Displaying data
The data displayed in your chart will be determined by the label and data columns.
Label Column Provides the name of each categorical variable.
Data Column(s) Provides the value or range of values for each label.
Data column typeData columns must be numeric (eg; containing values that can be converted to numbers)
Generating the chart schema
For table datasources, the available options for the label and data columns will match the columns of the table.
Data from REST Queries on the other hand, will likely need to be transformed to be suitable for use in charts.
In particular, your Transformer and Schema should align with the following:

Naturally you would replace the strings and numbers with response data from your API.
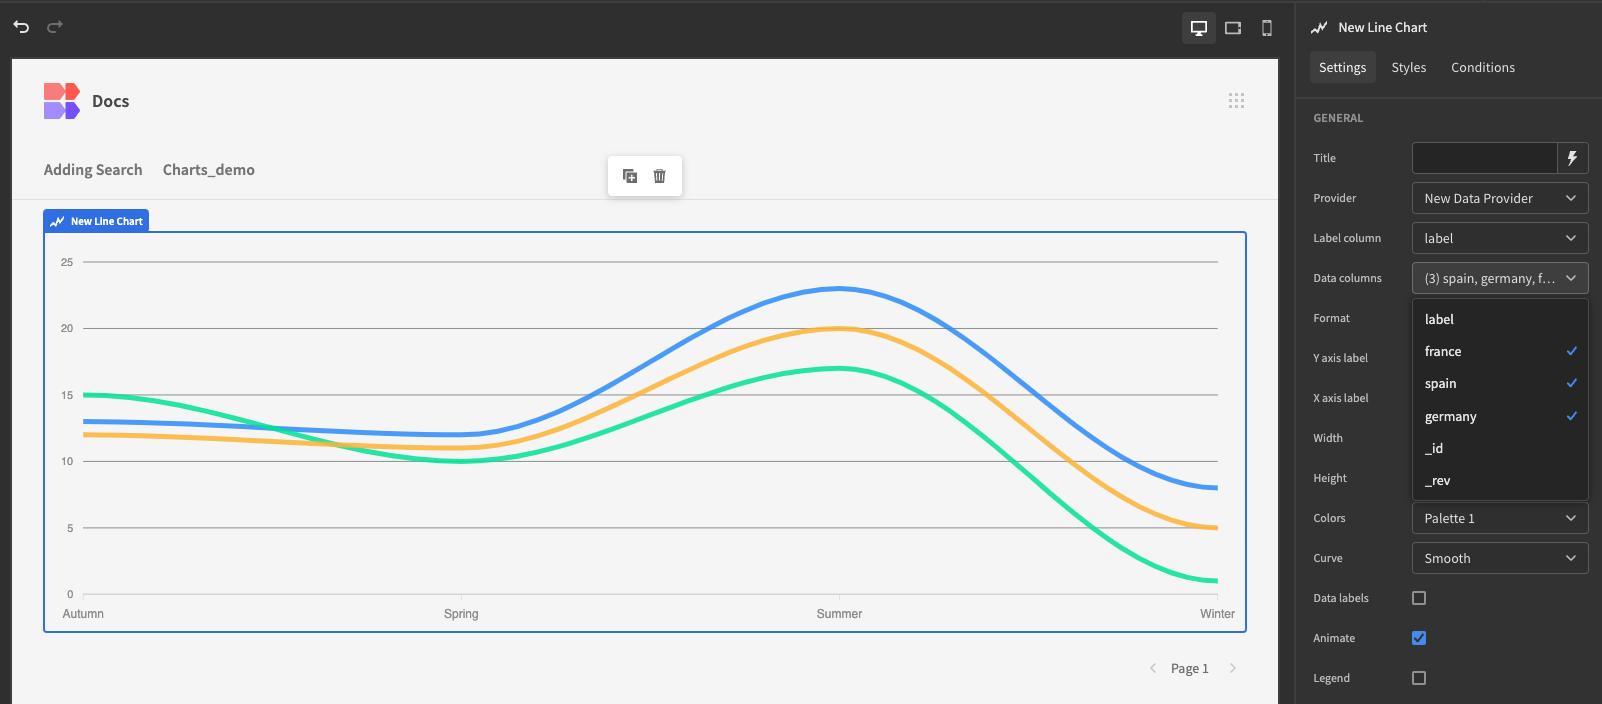
Many data columns
Most chart types can make use of more than one value column. Thus, additional value fields would be needed in your schema.
For example, you may want to display the change in average temperature between seasons for each country: